
PSA Density Velocity is the Most Important Predictor of Grade Group Progression During Prostate Cancer Active Surveillance
Andrew Gusev, BA, Florian Rumpf, BA, Dimitar Zlatev, MD, Jeffrey Twum-Ampofo, MD, Carl Ceraolo, BA, Keyan Salari, MD PhD, Douglas Dahl, MD, Matthew Wszolek, MD, Michael Blute, MD, Adam S. Feldman, MD MPH.
Massachusetts General Hospital, Boston, MA.
BACKGROUND:
Active surveillance (AS) is an established option in the management of appropriately selected men with prostate cancer. Prostate-specific antigen density (PSAd) at diagnosis is an important predictor of disease progression, however change in PSAd over time, or PSAd velocity (PSAdv), has not been thoroughly assessed. We sought to investigate the prognostic impact of PSAdv in men on AS.
METHODS:
Within our institutional database of 1268 men enrolled in AS for prostate cancer between 1997-2016, we retrospectively identified patients with at least two PSA values and prostate volume measurements by radiologic imaging. PSAd was calculated as PSA divided by prostate volume on transrectal ultrasound (TRUS) or magnetic resonance imaging (MRI). PSAdv was calculated as the difference between two PSAd measurements divided by the time between them. The primary outcome was freedom from pathologic progression to grade group (GG) 2 or higher on any follow-up biopsy during AS. Logistic regression was used to determine clinical factors predictive of GG progression. A sensitivity and specificity analysis with receiver operator curve (ROC) was utilized to identify the optimal PSAdv threshold for distinguishing risk of GG progression. Using this cut-off point, survival analysis was conducted with the Kaplan-Meier method and log-rank test.
RESULTS:
631 patients met criteria and were evaluated in this study. At diagnosis, median values were: age 64 years (IQR 59-69), PSA 5.1 ng/mL (IQR 4.0-6.8), PSAd 0.11 ng/ml/ml (IQR 0.08-0.16), percent of cores positive 8.3% (IQR 8.3-16.7), maximum single-core involvement 10% (IQR 5-20). The majority of patients had GG 1 (98%) and clinical stage T1c (94%) disease. During AS, median follow-up time was 5.7 years (IQR 4.0-8.3) and number of prostate volume measurements was 2 (IQR 2-3). 404 patients (64%) had PSAd values calculated using volumes only from TRUS, while the rest utilized both TRUS and MRI. Median time between PSA and prostate volume measurement was 37 days (IQR 19-61) and 16 days (IQR 1-39) for TRUS and MRI, respectively. Median PSA density velocity was +0.001 ng/ml/ml per year (IQR -0.02 - 0.03). 157 patients (25%) had GG progression on surveillance biopsy, with median time to progression 2.8 years (IQR 1.3-4.6). 241 patients (38%) progressed to treatment. On multivariable regression, PSAdv was the most significant predictor of GG progression (p=0.002) [Table 1]. On sensitivity and specificity analysis, the optimal PSAdv cut-off value was determined to be 0.0055 ng/ml/ml/year. 269 patients in this cohort (43%) with PSAdv above this threshold had a significantly greater risk of GG progression during the course of surveillance (p<0.001) [Figure 2].
CONCLUSIONS:
In our analysis, PSAdv is the most significant predictor of GG progression on follow-up biopsy during the course of AS. It therefore represents an important adjunct measure for prognostication of outcomes for men during AS. 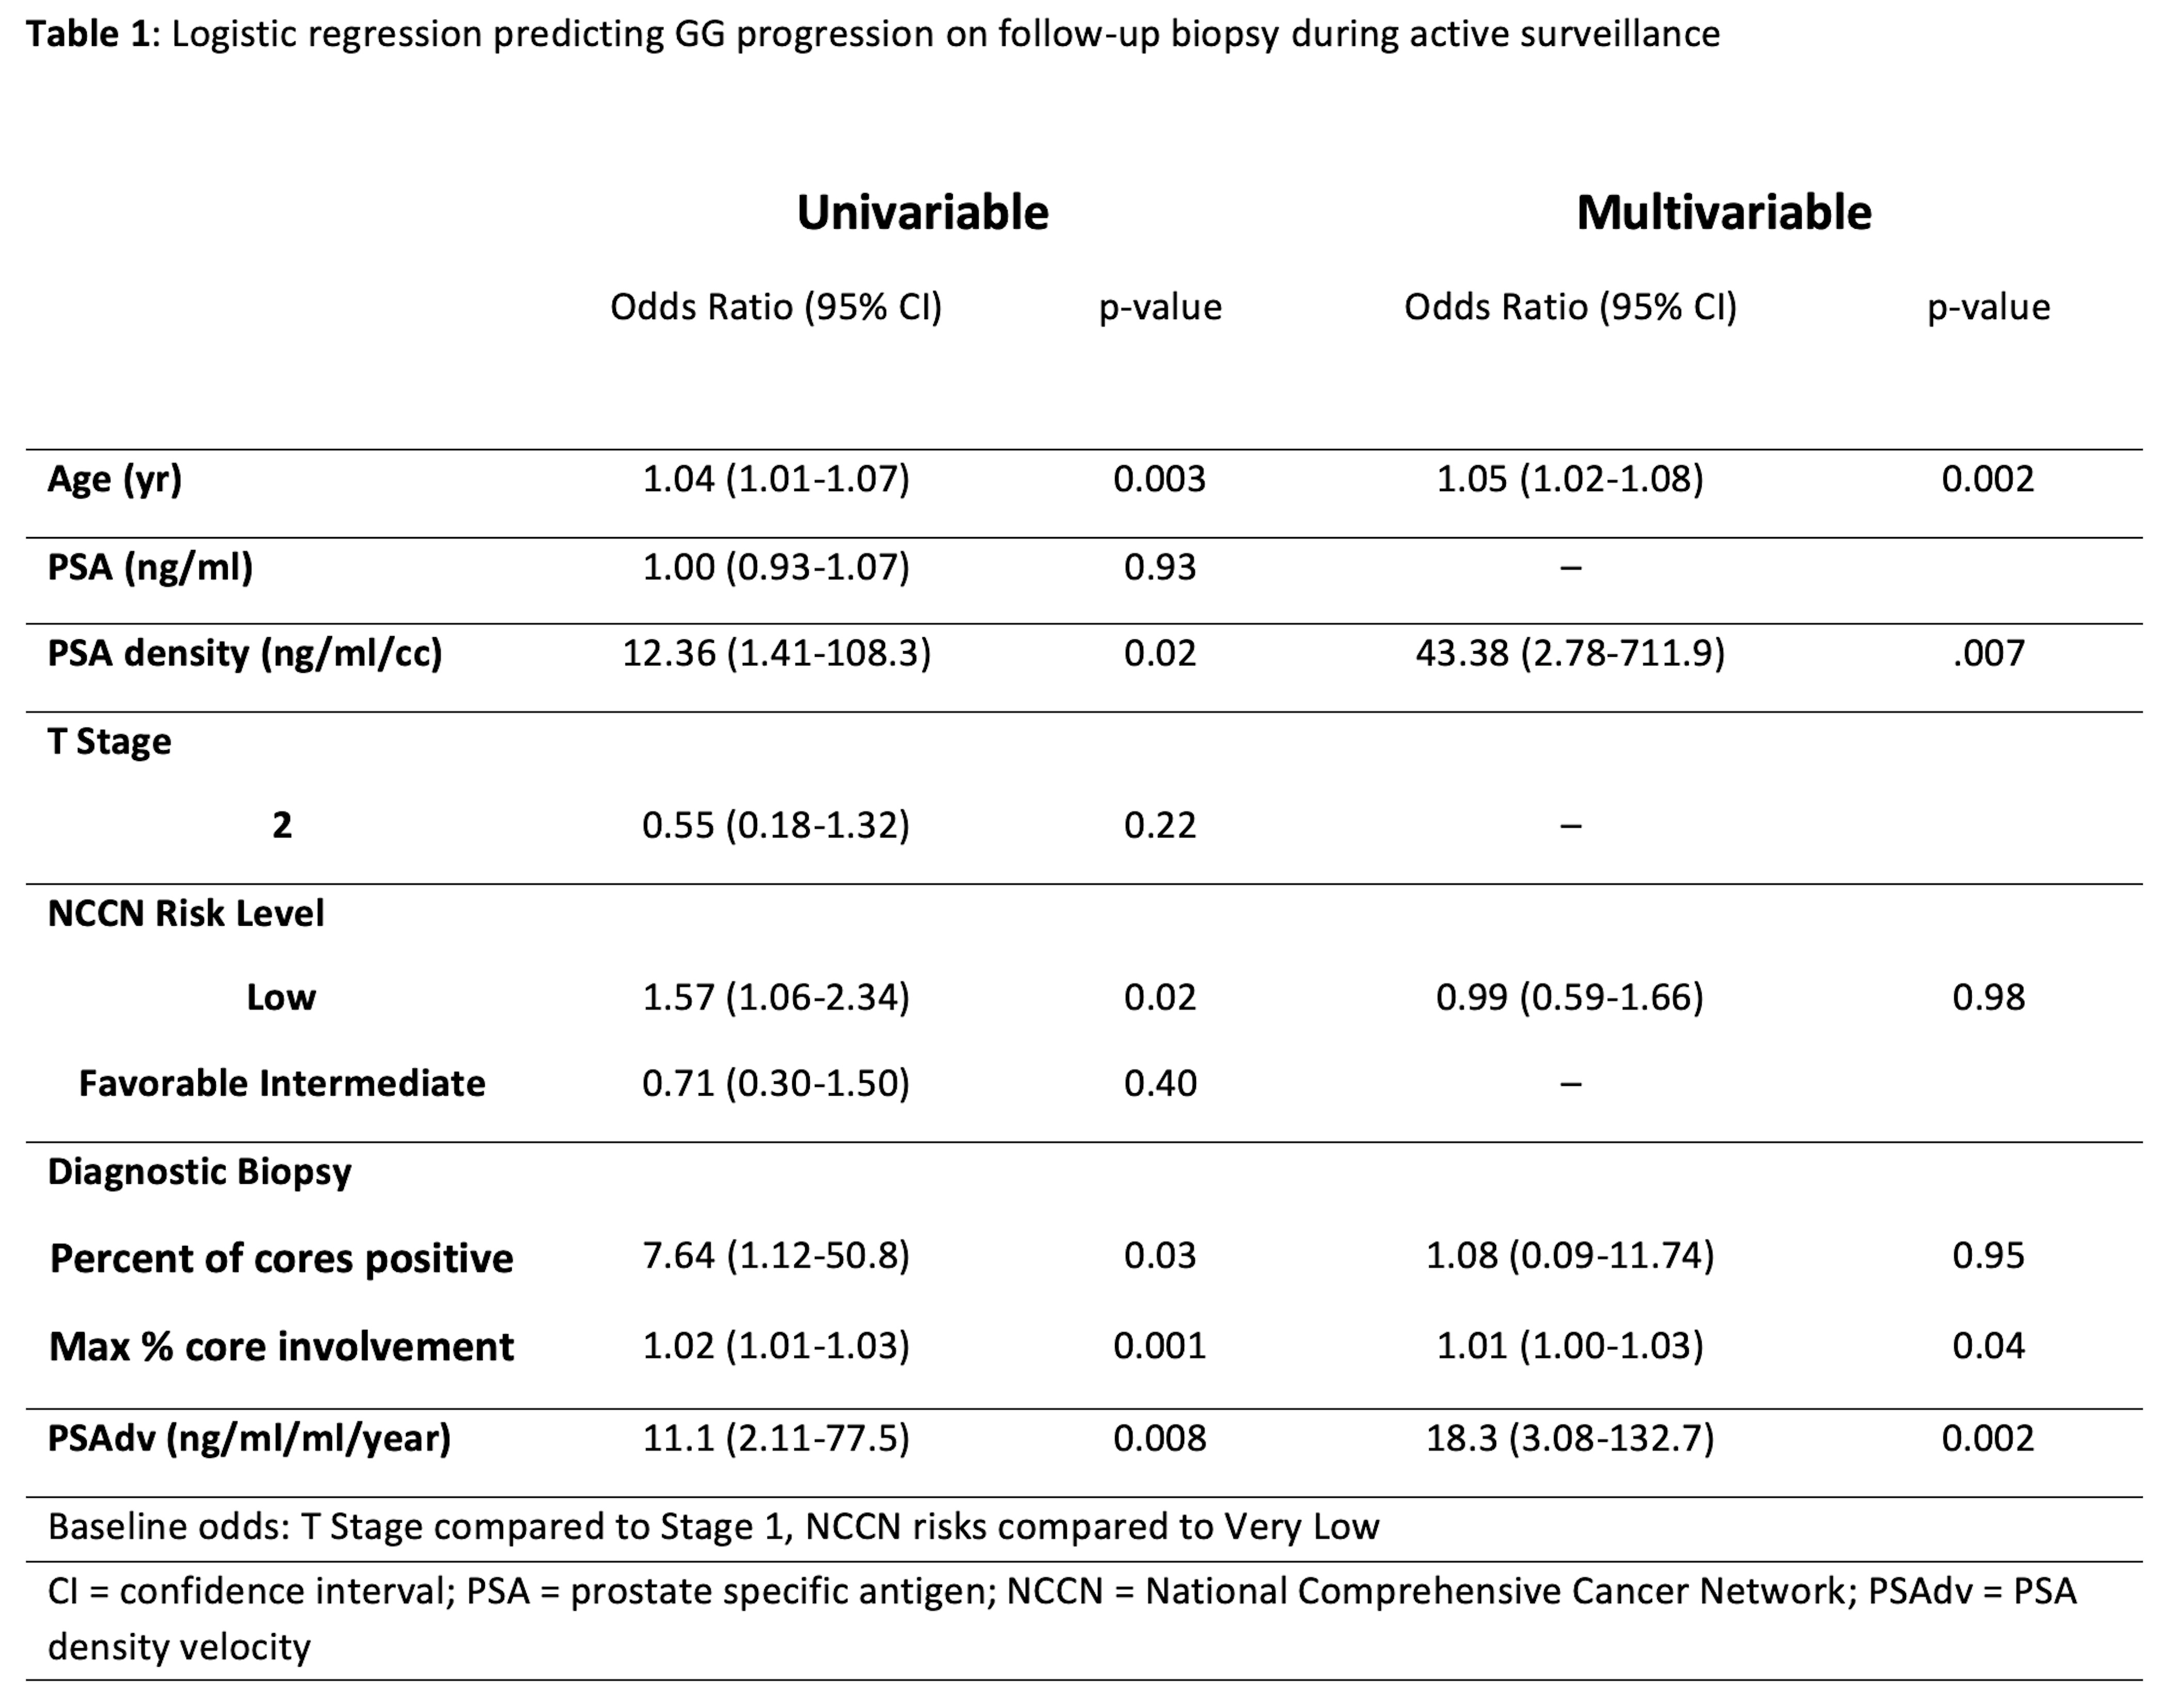

Back to 2020 Abstracts