Back to 2017 Program
The Learning Curve for Multi-parametric MRI/US Fusion Guided Prostate Biopsy: A Single Center Experience
Cynthia P. Leung, M.D.1, Jamil S. Syed, B.S.1, Shu Pan, M.D.1, Thomas B. Neville, Ph.D.2, Preston C. Sprenkle, M.D.1.
1Yale University, New Haven, CT, USA, 2Soar BioDynamics, Inc., New Haven, CT, USA.
Introduction
Multi-parametric MRI (mpMRI) with ultrasound fusion targeted biopsy has been increasingly utilized as a diagnostic procedure for patients suspected of having prostate cancer. Several aspects of fusion biopsy require learning, including lesion targeting and the operational knowledge of the various fusion biopsy devices. As targeted biopsy gains further adoption in prostate cancer diagnostics, understanding the learning curve of the procedure will be helpful for institutions considering implementation into their practice.
Methods
We retrospectively reviewed 112 mpMRI/US fusion targeted biopsies performed at our institution utilizing the ArtemisTM (Eigen) fusion biopsy device. Each biopsy was performed by one of four urologic residents with no prior experience performing fusion targeted biopsy. Supervision was available by an attending with experience in the technique. Biopsies are performed under monitored anesthesia care or local anesthesia, with an average of 5 biopsy cores obtained from each region of interest (ROI). This is followed by a 12-core systematic biopsy using a software generated template. Operative records were used to document the primary end point of length of procedure (LOP). Time is started with insertion of ultrasound probe into the rectum and is stopped upon removal. Analysis of variance and chi-square tests were used to compare continuous and categorical variables respectively. Multiple linear regression was utilized to assess independent predictors of LOP.
Results
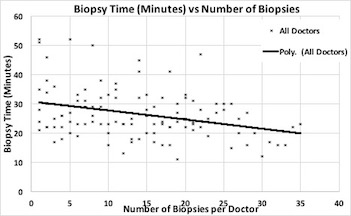
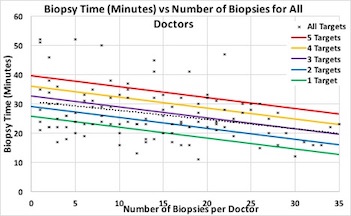
Overall, LOP decreased with increasing operator experience. Average LOP for the first ten cases was 29.2 minutes, standard deviation (SD 9.4). From the tenth to the twentieth case, LOP significantly decreased to 24.9 minutes, (SD 8.5), p<0.01. There were no significant differences in the number of ROIs detected on mpMRI by our radiologists over time (p=0.44). Lower number of ROIs and increasing biopsy experience were both significant predictors of shorter LOP (p<0.01 for both).
Conclusion
Results of our study demonstrate an improvement in LOP with increasing user experience, independent of number of ROIs. In addition, the number of ROIs were shown to independently influence LOP. Although use of this new technology is associated with a steep learning curve, our study demonstrated a substantial improvement within the first twenty procedures, suggestive of basic proficiency. Additional longitudinal data may further elucidate variables associated with physician learning curve.
Average Time by case number | | | | | | | | 95% CI | | Average minutes | SD | Lower | Upper | | Cases 1-10 | 29.22 | 9.356 | 26.41 | 32.03 | | Cases 11-20 | 24.88 | 8.534 | 22.15 | 27.6 | | Cases 21-30 | 24.9 | 7.321 | 21.57 | 28.24 |
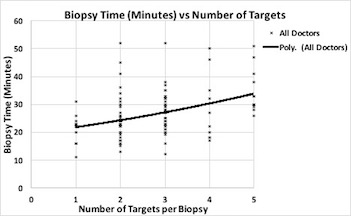
Multiple linear Regression | | | | | | | Coefficients | Lower 95% | Upper 95% | P-value | | Biopsy Number | -0.374872364 | -0.528112207 | -0.221632522 | <0.001 | | Number of targets | 3.461796283 | 2.246615955 | 4.676976612 | <0.001 |
Back to 2017 Program
|
|
|
|


