|
Back to 2011 Program
Cost Comparison of Open, Laparoscopic, and Robot-assisted Partial Nephrectomy
Mehrdad Alemozaffar1, Steven L Chang2, Mayellen Sun1, Ravi Kacker1, Andrew A Wagner1
1Beth Israel Deaconess Medical Center, boston, MA;2Brigham and Women's Hospital, boston, MA
Introduction and Objectives
Laparoscopic and robotic partial nephrectomy (LPN and RPN) are increasingly common minimally invasive alternatives to open partial nephrectomy (OPN) in the management of renal tumors. We compared the costs associated with each procedure.
Methods
Hospital variable costs including operating room (OR) time, supplies, anesthesia, inpatient care, radiology, pharmacy, and laboratory charges were captured for the last 25 patients who underwent OPN, LPN, and RPN at our institution prior to September 2010.
Results
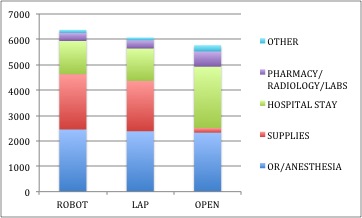
Our Results are listed in Table 1. We found similar overall costs for OPN, LPN, and RPN (\,774 vs. \,074 vs. \,374, p=0.1166) (Figure 1). OR supplies contributed a greater cost for LPN and RPN than OPN (\,179 vs. \,987 vs. \, p<0.001), while the inpatient stay cost was disproportionately higher for OPN compared to LPN and RPN (\,418 vs. \,305 vs. \,274, p<0.001). Sensitivity analysis demonstrated that RPN and LPN represent less costly alternatives to OPN (if OPN parameters are kept the same) if the average hospital stay for RPN and LPN is <2 days or OR time less than 204 and 196 minutes, respectively.
Conclusion
There were no statistically significant differences among variable costs associated with OPN, LPN, and RPN.
Table 1. Perioperative Outcomes and Costs | Robot | Laparoscopic | Open | P-value RPN vs. LPN | P-value RPN vs. OPN | P-value LPN vs. OPN | Kruskal- Wallis analysis | | Age (mean years) | 55.9 + 11.7 | 53.3 + 13.7 | 61.9 + 10.1 | 0.477 | 0.0554 | 0.0142 | 0.0432 | | Tumor Size (cm) | 2.5 + 1.0 | 3.3 + 1.3 | 3.3 + 1.4 | 0.0279 | 0.0298 | 0.900 | 0.0661 | | RENAL Score | 6.08 + 1.68 | 7.04 + 1.70 | 7.00 + 1.56 | 0.05 | 0.0532 | 0.932 | 0.0659 | | OR Time (min) | 231.8 + 44.2 | 223.8 + 43.2 | 238.3 + 119.5 | 0.536 | 0.804 | 0.572 | 0.732 | | EBL | 178 + 205.7 | 154 + 114.5 | 275.4 + 170.0 | 0.613 | 0.0742 | 0.0047 | 0.0079 | | Length of Hospital Stay (days) | 2.48 + 0.68 | 2.72 + 0.67 | 4.6 + 1.68 | 0.353 | 0.0001 | 0.0001 | 0.0001 | | Overall Cost | 6374 + 1318 | 6074 + 758 | 5774 + 2420 | 0.329 | 0.281 | 0.557 | 0.1166 | | Supply Costs | 2178 + 225 | 629 + 125 | 180 + 118 | 0.0001 | 0.0001 | 0.0001 | 0.0001 | | Hospital Costs | 1304 + 891 | 3260 + 469 | 2418 + 1501 | 0.0001 | 0.0025 | 0.0101 | 0.0001 |

Back to 2011 Program
|